
Optimising a Minecraft server is not about pasting random values into config files — it is about measuring first and then changing one thing at a time: the target is 20.0 TPS and an MSPT below 50 milliseconds per tick, and as long as MSPT stays under 50 ms your server holds 20 TPS. When lag appears, upgrading RAM usually changes nothing, because the cause is almost always one of four things: entity load, chunk generation, redstone, or garbage collection pauses. This guide covers finding the problem and changing the right setting in the right place.
Separating these two numbers is the foundation of all optimisation.
The relationship: as long as MSPT does not exceed 50 ms, TPS stays at 20. Which is why MSPT is the number to watch — by the time TPS starts dropping it is already too late, but at 45 ms you still have room to act.
Another important distinction: if TPS is low but player ping is normal, the problem is server-side processing. If ping is high too, look at the network or location instead.
spark is the profiling and monitoring tool for Minecraft servers, and optimisation starts here. Its core commands:
/spark tps — current TPS and CPU usage./spark health — an overall report covering TPS, CPU, memory and disk usage./spark profiler — samples CPU and memory usage and produces a detailed report, uploaded to an online viewer./spark tickmonitor — tracks individual ticks exceeding a threshold, ideal for catching spikes.Two rules for using it properly. First: profile while the lag is happening, not on a quiet server. A report taken on an idle server tells you nothing.
Second, and more important: in the flame graph, a wide branch is not proof that the code is defective — it only shows where sampled time was spent. A plugin may look wide because it is doing the actual work. Always read the graph alongside what players were doing at the time: who was where, which farm was running, was someone flying into new terrain?
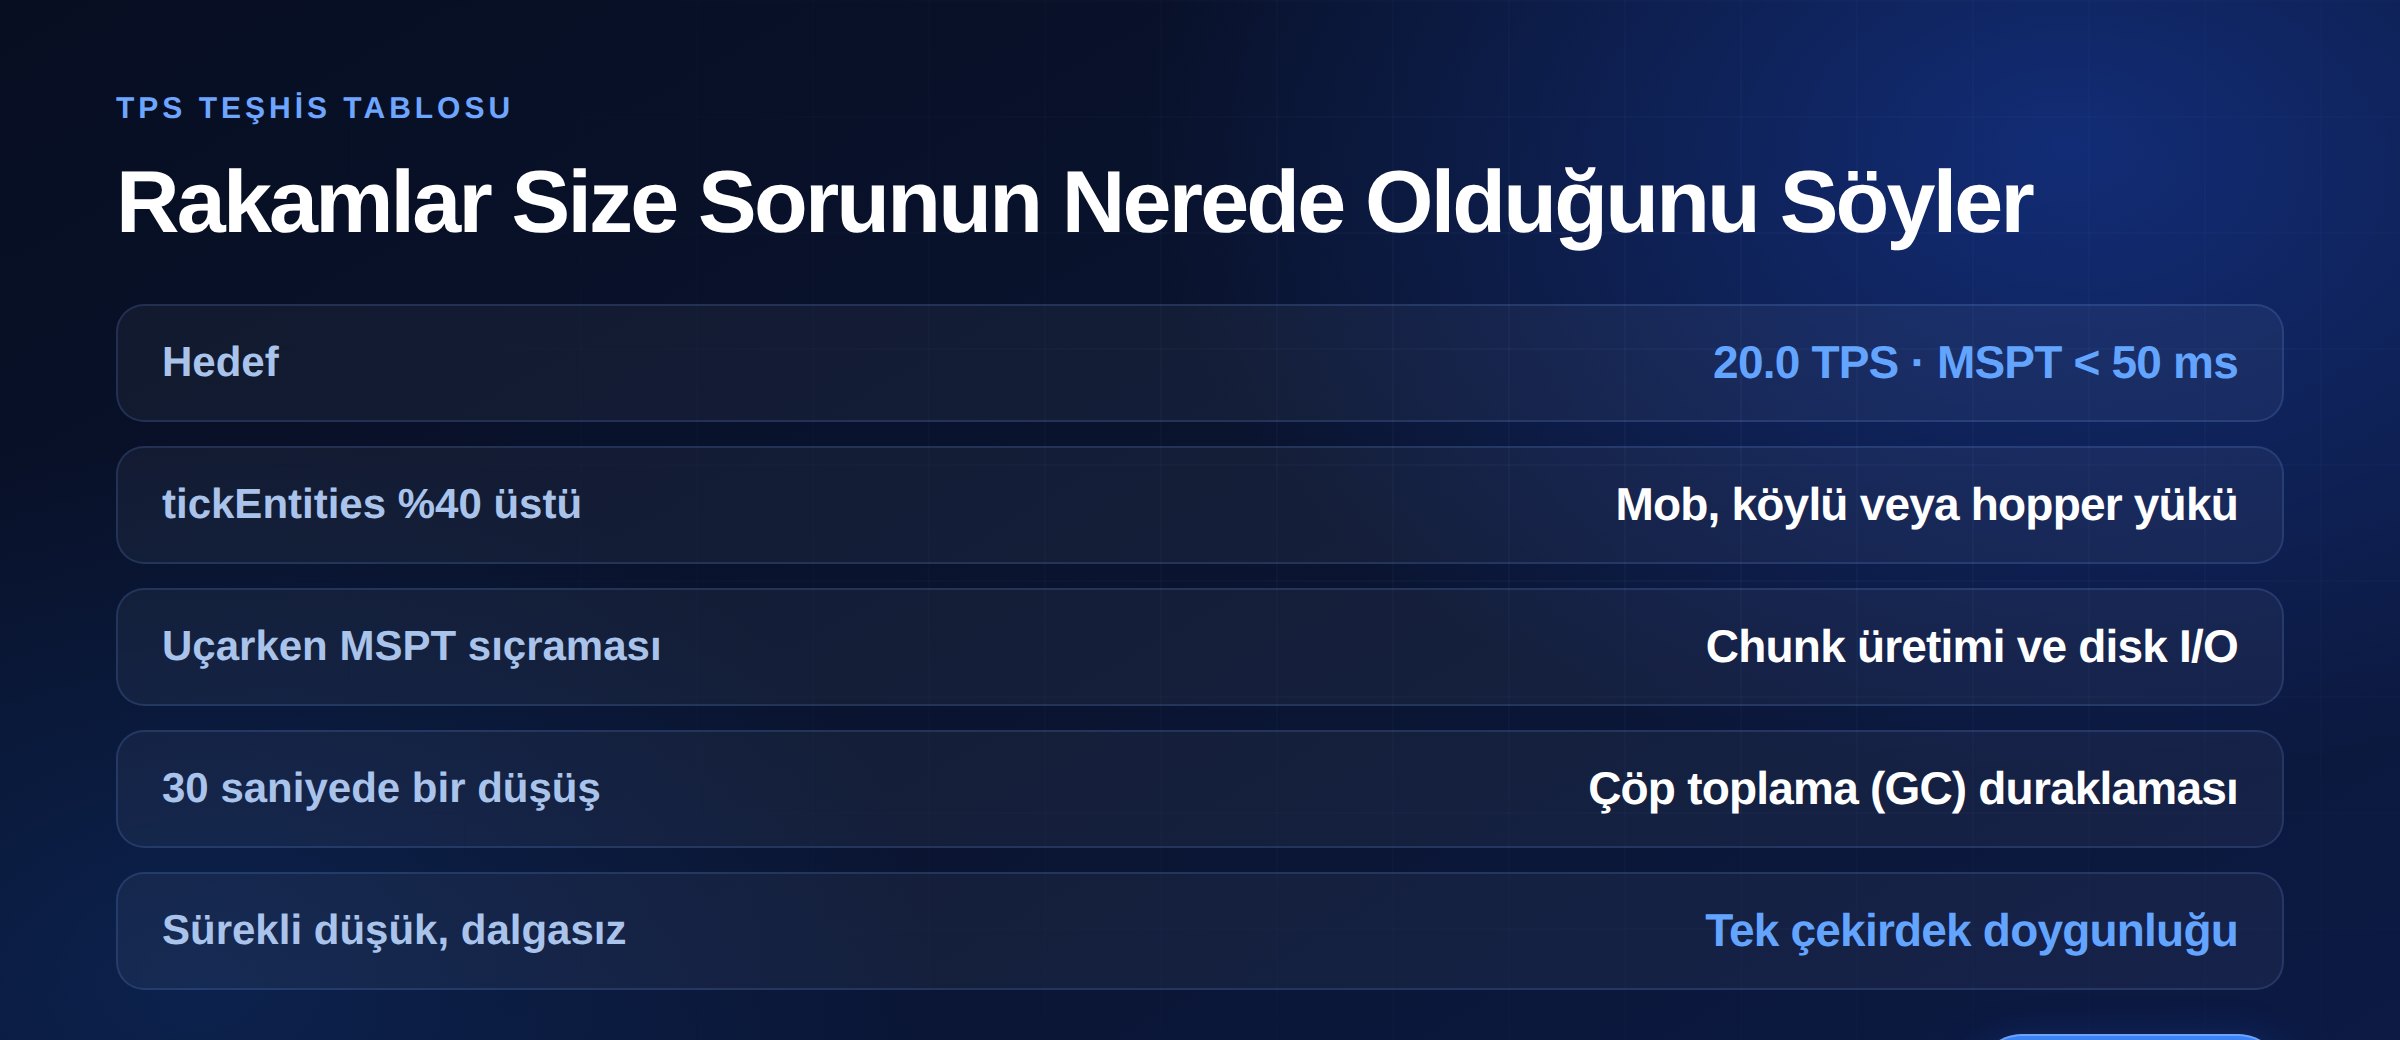
If ServerLevel#tickEntities exceeds 40% of CPU usage in the profile, the culprits are mobs, villagers and item piles. The two most frequent sources: villager pathfinding calculations and large hopper arrays.
When a player flies toward ungenerated terrain, the server has to generate chunks and write to disk in real time. MSPT spikes noticeably at those moments. The symptom is clear: lag starts when players explore and is absent during normal play.
Vanilla redstone triggers cascading lighting and block updates. On servers with large redstone builds it generates serious load on its own.
The symptom is very characteristic: TPS drops recurring at regular intervals — every 30 seconds, for example. That is Java freezing the main thread to clean up memory. The cause is usually not insufficient RAM but a badly sized heap and GC settings.
The most common mistake when following optimisation guides is looking for a setting in the wrong file. Paper has moved away from the old single paper.yml; the current structure is:
server.properties — vanilla settings: view-distance, simulation-distance, max-players.bukkit.yml — core Bukkit settings such as mob spawn limits.spigot.yml — Spigot settings such as entity-activation-range and merge-radius.config/paper-global.yml — server-wide Paper settings.config/paper-world-defaults.yml — default values for all worlds.world/dimensions/<namespace>/<key>/paper-world.yml — per-world overrides.The system works by inheritance: anything not explicitly defined for a world is inherited from paper-world-defaults.yml. So you do not copy the whole configuration into every world — only the exceptions.
These deliver most of the gain on most servers. Do not apply them all at once — change one at a time and test under real load.
The two values with the largest single impact. view-distance sets how many chunks are sent to the client; simulation-distance sets how many are actively ticked — and the second is the real source of CPU load. On busy servers, 6–8 is a reasonable starting range. Keep simulation distance below view distance: players see distant terrain without those chunks being processed.
entity-activation-range in spigot.yml determines from what distance mobs start being ticked. Lowering it modestly for animals and monsters reduces load — but going too far makes mobs freeze right in front of players and ruins the feel of the game.
Increasing merge-radius slightly for dropped items combines ground piles and reduces entity count.
Paper's max-entity-collisions (default 8) caps collision processing. The only-players-collide option further restricts collision detection to player-involved cases — a visible difference on servers with mob-packing farms.
Hoppers are a silent TPS killer. Three Paper settings help directly: cooldown-when-full applies a brief delay to full hoppers, ignore-occluding-blocks skips unnecessary container scanning, and disable-move-event — in the documentation's own words — dramatically improves hopper performance. Before enabling the last one, check whether any plugin depends on hopper move events.
delay-chunk-unloads-by postpones unloading (in duration format such as 10s or 25m) — breaking the constant load/unload cycle in areas players move back and forth through. max-auto-save-chunks-per-tick (default 24) limits how many chunks are saved per tick, smoothing spikes during auto-save.
Paper lets you change the redstone implementation: VANILLA, EIGENCRAFT or ALTERNATE_CURRENT. Alternative engines produce the same result with more efficient algorithms and make a visible difference on servers with large redstone builds. Test in a staging world first, as behaviour can differ.
optimize-explosions reduces the computation involved in explosions. update-pathfinding-on-block-update controls whether mob navigation is recalculated on every block update — worth reviewing on villager-heavy servers.
If you see TPS drops at regular intervals, the problem is here. Three rules:
-Xms equal to -Xmx. This eliminates wasted allocation.-Xmx you could not support if fully consumed. The operating system needs its own capacity.In the G1GC configuration commonly used on Minecraft servers, values such as -XX:G1NewSizePercent=50, -XX:G1MaxNewSizePercent=80 and -XX:InitiatingHeapOccupancyPercent=10 are used up to 10 GB; above 10 GB these become 35, 60 and 15 respectively.
We covered how much RAM you need and how to pick a plan in our Minecraft server buying guide.
What matters is not plugin count but the load they generate. Thirty lightweight plugins can cause fewer problems than five badly written ones. How to audit:
For plugin installation, updating and the /reload trap, see how to add plugins to a Minecraft server. In short: never use /reload on a live server — it does not shut plugins down cleanly, producing memory leaks and scheduled-task conflicts whose symptoms surface hours later.
Some lag sources are not in a config file but inside your world:
merge-radius largely solve this.These problems need rules as well as technical fixes: farm size limits, recommending more efficient alternatives to hoppers, and regular world audits. Trying to solve it with settings alone does not hold up over time.
A Minecraft server does most of its work on a single thread. So what determines TPS is not core count but the processor's clock speed and generation. A four-core server on a high-clocked current-generation processor can deliver higher TPS than an eight-core older one.
Storage matters more than it appears too: chunk loading, auto-save and the disk I/O that grows with world size all differ noticeably between NVMe M.2 SSD and SATA.
And there is a measurable trap: if your server runs on shared resources, your TPS is not under your control. Run top on Linux and read the %st (steal time) value on the CPU line — consistently above 10% during busy hours means the physical host is overloaded, and no setting fixes that. We covered the whole topic in our guide on the difference between VDS and VPS.
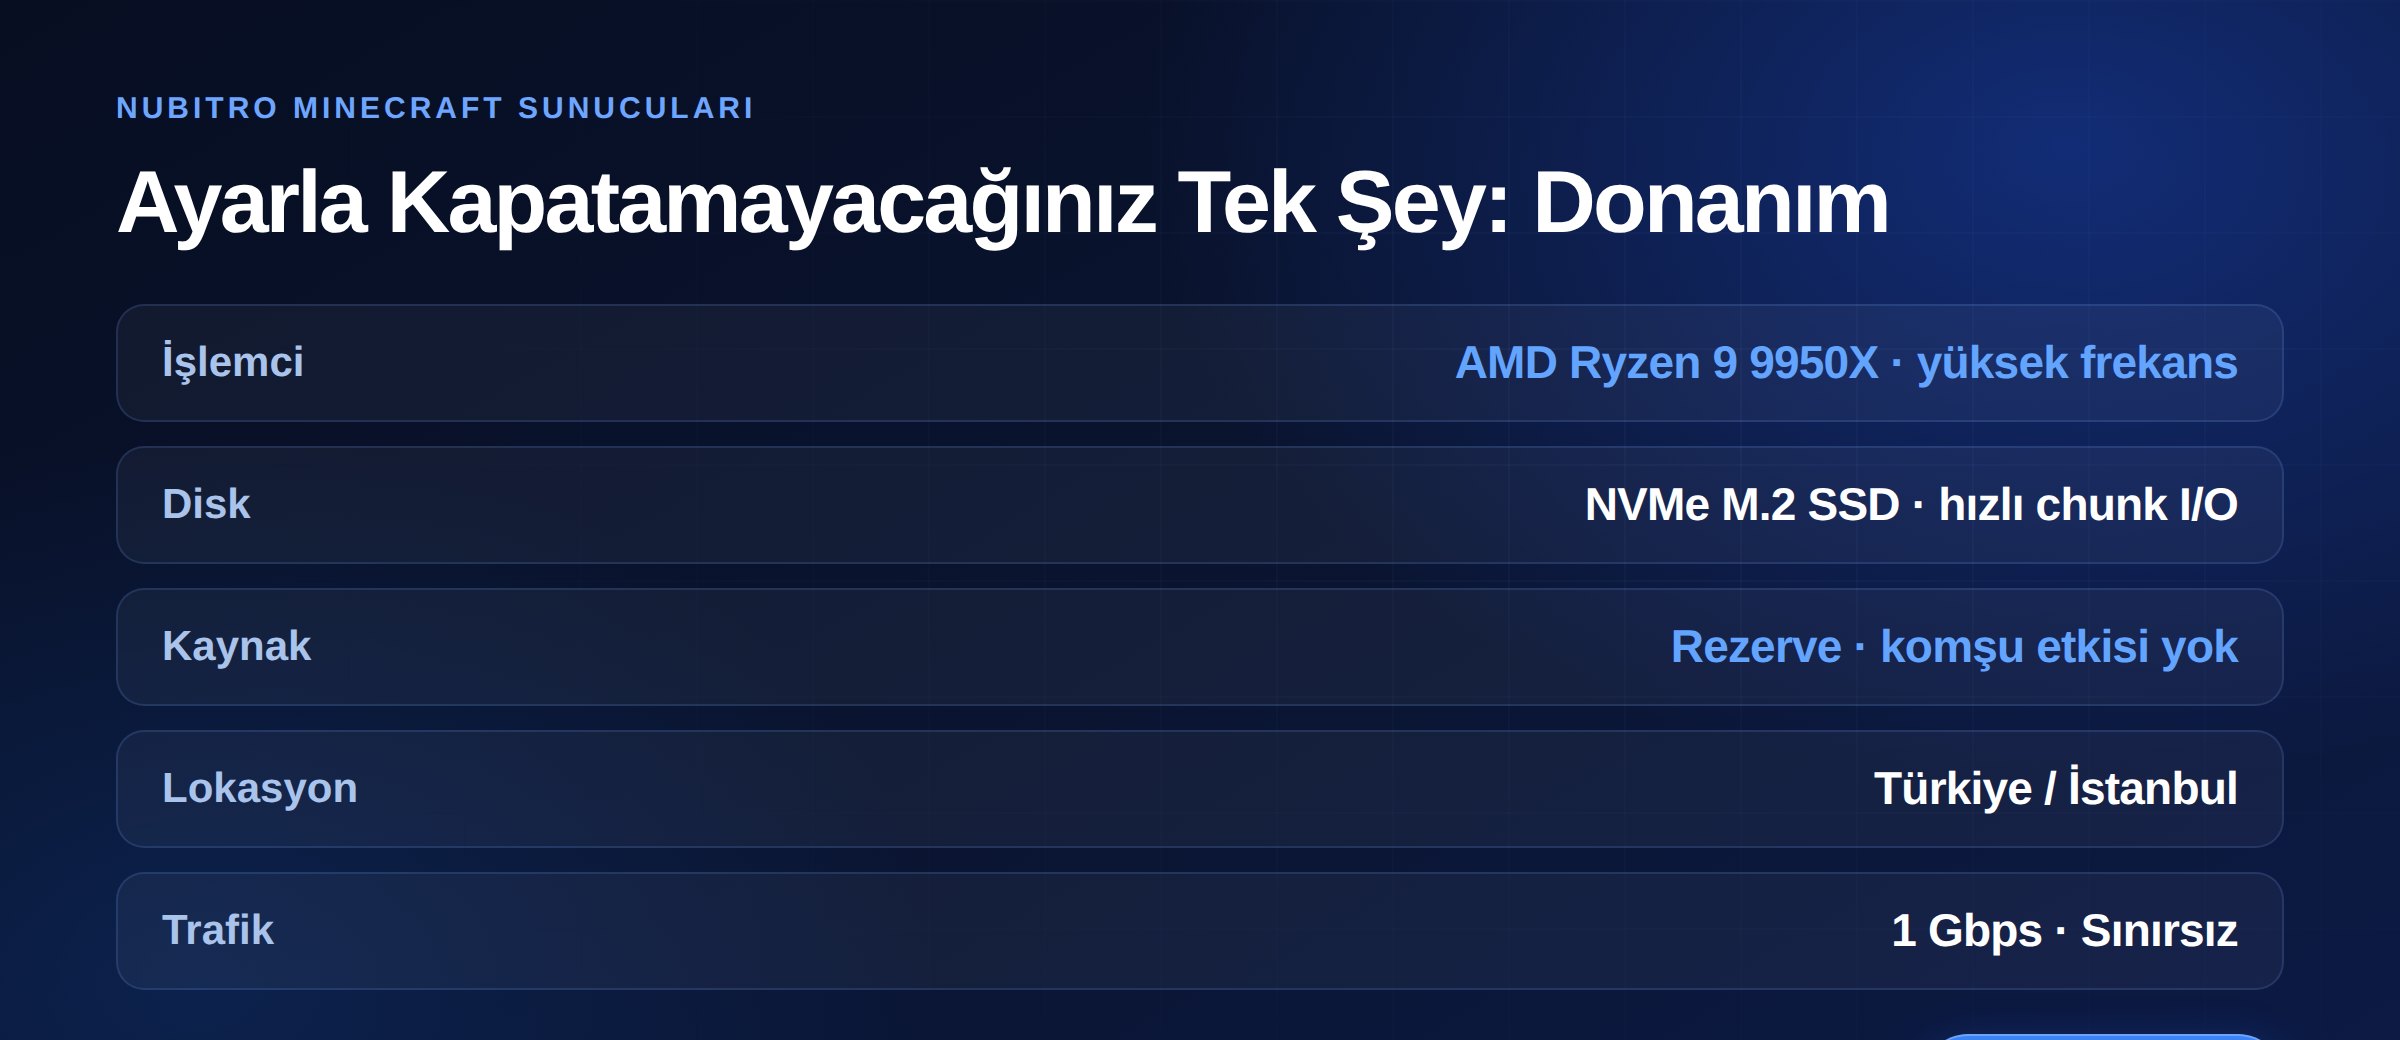
Even with every setting above done right, hardware sets the ceiling on TPS. Nubitro Minecraft servers run on AMD Ryzen 9 9950X processors in Istanbul, Turkey, with NVMe M.2 SSD storage and 1 Gbps unmetered traffic.
Because resources are assigned through hardware partitioning, neighbour load does not reach your tick time — meaning the TPS you measure really is your server's performance. Plans scale from 2 cores / 4 GB RAM up to 6 CPU / 32 GB RAM.
Review the plans on our Minecraft server hosting page, or see Ryzen VDS to build your own configuration. For everything else, visit the Nubitro homepage.
TPS measures the server side, not what players experience. If the server holds 20 TPS while players feel lag, the problem is the network: ping, packet loss or distance. If your player base is in Turkey, an overseas location alone adds 40–60 ms.
Yes, very common. Adding RAM helps only if you were genuinely memory-starved. Drops at regular intervals point to GC settings; steady, flat low TPS points to single-core saturation. Neither is fixed with RAM.
6–8 is a reasonable starting range on busy servers, with simulation distance kept below it. But measure at your current value first — on some servers the bottleneck is entity load rather than distance, and lowering it only degrades the experience.
Not immediately. A wide branch shows where sampled time was spent, not that the code is broken — the plugin may simply be doing the real work. Read the report alongside player activity at the time, and if possible disable the plugin on a test server and re-measure.
Use them as a starting reference, but do not paste them wholesale. These packs are usually built for a specific server type and can contain aggressive values; the result is gaining TPS while ruining how the game feels. Apply each setting deliberately, one at a time.
Not the file size directly — exploration into ungenerated terrain does. If players constantly open up new areas, chunk generation spikes MSPT. Setting a world border makes that load predictable.
ServerLevel#tickEntities exceeds 40%, the problem is mob, villager and hopper load.paper-global.yml, paper-world-defaults.yml and per-world paper-world.yml.-Xms and -Xmx should match; an oversized heap worsens GC freezes./reload on a live server.%st above 10% means TPS is not under your control. Turkey (Türkçe)
 Worldwide (English)